Did you know over 35 candlestick patterns exist? They help traders analyze market trends. The doji pattern is key, showing market indecision. This guide explores doji candlesticks, their role in technical analysis, and how they influence trading strategies.
Candlestick patterns show price movements. They capture open, high, low, and close prices for certain times. These patterns reveal market sentiment, helping traders forecast price changes. The doji is unique, signaling market reversals and continuations.
We’ll dive into the magic of doji candlesticks. They have a long history, from ancient Japanese rice trading to today’s global markets. This guide will teach you to read these signals and use them in your trading plan.
Key Takeaways
- Doji patterns signal market indecision and potential trend reversals
- Candlestick charts provide crucial data on price movements
- Time frames affect the appearance and significance of candlestick patterns
- Single and two-candle reversal patterns offer insights into market sentiment
- Real-life examples demonstrate practical applications of doji patterns
- Modern variations like Golden and Shrinking patterns expand on classic formations
The Origins of Candlestick Charting
Japanese candlestick charts have a long history, starting in 17th-century Japan. Rice traders in feudal Japan created this method to track rice prices. It became so useful that it spread to other markets and financial areas.
Ancient Japanese Rice Traders
Munehisa Homma, a wealthy rice merchant from Sakata, is the founder of candlestick charting. He carefully recorded price patterns and market feelings. This work is the base of today’s technical analysis.

Introduction to Western Markets
Steve Nison introduced Japanese candlestick charts to the West in the late 20th century. His book, “Japanese Candlestick Charting Techniques,” made this tool known to traders and analysts. Nison’s work changed technical analysis, making candlestick charts essential in global financial markets.
Evolution of Candlestick Analysis
Since they arrived in the West, candlestick charts have grown a lot. They now include many patterns and formations, each with its own predictive value. Traders use these charts to find trend weaknesses, potential reversals, and shifts in market sentiment that standard bar charts might miss.
| Candlestick Pattern | Indication | Reliability |
|---|---|---|
| Doji | Market indecision | Moderate |
| Marubozu | Strong trend | High |
| Hammer | Potential reversal | High |
| Engulfing | Trend reversal | High |
Understanding the Anatomy of a Candlestick
Candlestick charts are a special way to see price changes and market feelings. They started in Japan over a hundred years ago. Now, they’re used on most online trading sites to help traders decide.
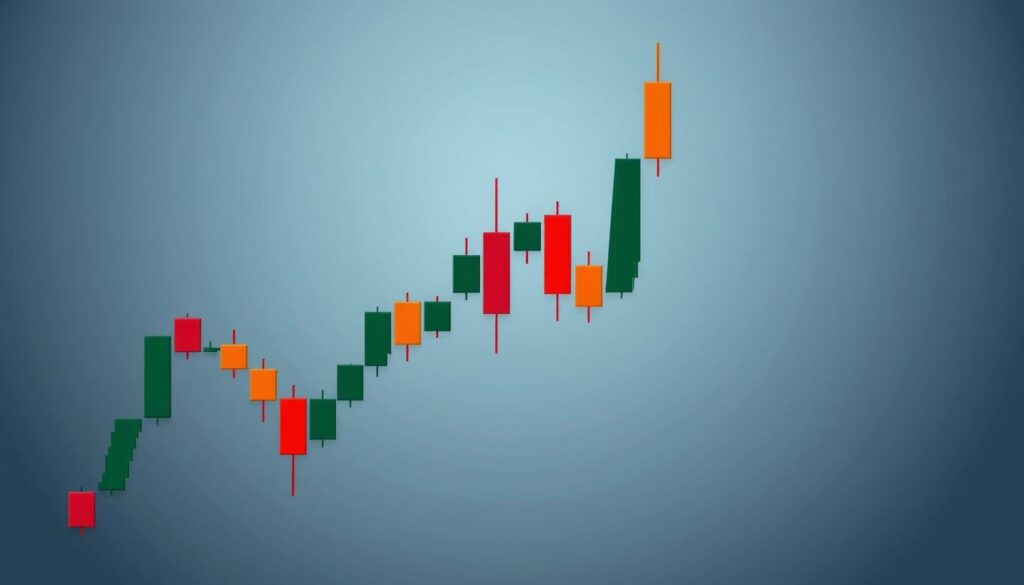
A candlestick has several important parts. Each one shows a time period and has four key prices: open, close, high, and low. The main part, or “real body,” shows the price change from start to end. The thin lines, or “shadows,” show the highest and lowest prices.

The color of the candlestick body tells us about price changes. A green or white body means prices went up (bullish). A red or black body means prices went down (bearish). This color helps traders quickly understand market feelings.
| Candlestick Component | Description | Significance |
|---|---|---|
| Real Body | The thick part of the candlestick | Shows the range between opening and closing prices |
| Upper Shadow | The thin line above the real body | Represents the highest price of the period |
| Lower Shadow | The thin line below the real body | Represents the lowest price of the period |
| Color | Green/White or Red/Black | Indicates bullish or bearish price movement |
By looking at these parts, traders can understand market feelings and future prices. The size and shape of the real body and shadows tell us about buying and selling. This helps traders make better choices in their trading plans.
The Significance of Doji Patterns in Technical Analysis
Doji candlesticks are key in technical analysis. They show market sentiment and possible trend changes. These patterns highlight moments of indecision, giving traders clues about future prices.
What is a Doji?
A doji candlestick happens when a security’s opening and closing prices are almost the same. This creates a cross-like shape on charts, showing a balance between buyers and sellers. Doji patterns are important because they often signal a pause in trends, possibly leading to a change.

Types of Doji Patterns
There are several doji variations, each with its own meaning:
- Classic Doji: Signals consolidation before a defined market move
- Long-Legged Doji: Suggests high volatility and potential reversal
- Dragonfly Doji: Indicates a possible bullish reversal
- Gravestone Doji: Often seen near market tops, signaling bearish reversal
Psychological Implications of Doji Formations
Doji patterns show the psychological state of market players. They mark moments of indecision and balance between buyers and sellers. This balance often leads to big price changes as traders adjust their strategies.
Understanding these psychological factors helps traders spot trend reversal signals. This knowledge aids in making smart decisions.
It’s important to remember that 69% of retail investor accounts lose money when spread betting and trading CFDs. This highlights the need for careful analysis and risk management when using doji patterns and other technical indicators.
Candlesticks Doji: Interpreting Market Indecision
Doji candlesticks are key for understanding market balance and spotting trading opportunities. They appear when a stock’s opening and closing prices are almost the same. This creates a cross-like shape on charts.
There are six main types of doji patterns: gravestone, long-legged, dragonfly, standard, 4-price, and neutral. Each type gives clues about market mood and future price actions. For example, a gravestone doji at the top of a rise often means a bearish shift. On the other hand, a dragonfly doji at the bottom of a fall hints at a bullish change.
Traders see doji patterns in three main ways:
- Market indecision
- Continuation of the current trend
- Possible trend reversal
While doji candlesticks are useful, they’re not always right. Their rarity and chance of false signals mean they should be used with other tools for better trading signals. For example, moving averages can help back up doji predictions and enhance market analysis.
“Doji patterns are like road signs in the market landscape. They don’t tell you exactly where prices will go, but they alert you to potential changes ahead.”
Learning to read doji patterns helps traders spot market balance and get reliable trading signals. This is true for different time frames and market conditions.
Doji in Trend Reversals: Spotting Potential Turning Points
Doji candlesticks are key in spotting trend reversals. They show up when the opening and closing prices are almost the same. This creates a cross-like shape on charts. Traders look for these patterns at support and resistance levels to predict market changes.
Doji at Support and Resistance Levels
A doji at a support or resistance level often means a trend pause. This pause might signal a change in direction. For instance, a doji at a strong resistance after an uptrend could mean buyers are losing strength. This could lead to a bearish turn.
Combining Doji with Other Technical Indicators
Traders boost doji signals by combining them with other indicators. Some common ones are:
- Relative Strength Index (RSI)
- Moving Average Convergence Divergence (MACD)
- Bollinger Bands
These pairs help confirm trend reversals and guide trading choices.
Case Studies of Successful Doji-Based Trades
Here’s a real example of a doji-based trade success:
| Asset | Pattern | Entry Point | Exit Point | Profit/Loss |
|---|---|---|---|---|
| EUR/USD | Dragonfly Doji at Support | 1.1200 | 1.1350 | +150 pips |
In this example, a trader saw a dragonfly doji at a support level. This signaled a possible bullish turn. By entering at the doji’s low and exiting at the next resistance, the trader made a profit.
Common Misconceptions About Doji Patterns
Doji pattern myths often lead to market analysis errors and impact trading psychology. Many traders think these candlestick formations always signal reversals. But, doji patterns really show market indecision and need context for correct interpretation.
It’s a common mistake to think all doji patterns are the same. There are five types: Regular, Long-Legged, Four-Price, Dragonfly, and Gravestone. Each has its own meaning for market sentiment and price movements.
Another myth is that doji patterns alone are enough for trading signals. But, they should be looked at with other technical indicators and market basics for better decisions. Relying only on doji formations can cause big trading mistakes.
“Doji patterns are not standalone reversal indicators. They primarily reflect market indecision and require additional confirmation.”
To avoid market analysis errors, remember these key facts about doji patterns:
- They can form anywhere on price charts
- Location determines bullish or bearish implications
- Size matters in interpretation
- Context is crucial for accurate analysis
Knowing these details helps traders improve their strategies and avoid common doji pattern mistakes.
| Doji Type | Characteristics | Potential Implication |
|---|---|---|
| Regular Doji | Equal open and close | Market indecision |
| Long-Legged Doji | Long upper and lower shadows | Increased volatility |
| Dragonfly Doji | Long lower shadow | Potential bullish reversal |
| Gravestone Doji | Long upper shadow | Potential bearish reversal |
Doji Strategies for Different Market Conditions
Doji trading strategies change with market trends. These patterns give insights into market mood, aiding traders in different situations. Let’s look at tactics for bull, bear, and sideways markets.
Bull Market Doji Tactics
In bullish markets, doji patterns hint at possible reversals or continuations. The Dragonfly Doji is a buy signal, especially near support levels. It shows strong buyers, pushing prices up.
Bear Market Doji Approaches
Bearish markets need unique doji strategies. The Gravestone Doji is key, signaling selling chances. It appears at resistance levels or during uptrend pullbacks, showing more sellers.
Sideways Market Doji Techniques
In ranging markets, the Long-legged Doji is very useful. It shows market indecision, often before big moves. Traders use it with other indicators to spot trend changes.
| Market Condition | Doji Type | Strategy | Risk Management |
|---|---|---|---|
| Bullish | Dragonfly Doji | Buy near support levels | Stop loss below the doji’s low |
| Bearish | Gravestone Doji | Sell at resistance levels | Stop loss above the doji’s high |
| Sideways | Long-legged Doji | Wait for breakout confirmation | Tight stops, smaller position sizes |
Adjusting doji analysis for different markets is key to trading success. Always think about volume, support and resistance, and other confirmation signs. Good risk management is vital in every market.
Advanced Doji Pattern Recognition Techniques
Doji candlestick pattern recognition has grown with automated trading systems. These systems use machine learning to spot complex doji patterns in different time frames. A study on Taiwan’s Stock Exchange and Japan’s Nikkei 225 found that combining candlestick patterns with advanced models improves market predictions.
Today’s automated trading platforms use advanced algorithms to find doji patterns. They quickly scan thousands of charts for trading chances that might slip by human traders. For example, a tool can check for 41 patterns, including dojis.
Machine learning has changed how we identify doji patterns. Deep learning on the NIFTY50 index showed it can predict bullish trends using candlestick patterns. This mix of old-school technical analysis and new AI gives traders a strong tool for market analysis.
| Pattern Recognition Parameter | Default Value | Function |
|---|---|---|
| Equal Percent | 0.50 | Determines pattern recognition |
| Long Shadow | 2 | Compares shadow to body length |
| Small Shadow | 1 | Assesses shadow length relative to body |
While automated systems are helpful, combining human insight with technology is key for doji analysis. Traders should know that patterns work better on longer time frames like 1-hour, 4-hours, or daily charts. Shorter time frames often have more noise, making patterns less reliable.
Integrating Doji Analysis into Your Trading Plan
Adding doji patterns to your trading plan can really help. These special candlestick shapes give clues about market mood and possible trend changes.
Risk Management with Doji Signals
It’s key to keep a good risk-reward ratio when using doji signals. Place stop-loss orders below the doji’s low for long trades or above its high for shorts. This method cuts down on losses and boosts profit chances.
Timeframe Considerations for Doji Patterns
Doji patterns act differently in different time frames. Short-term traders might look at 15-minute or hourly charts. Long-term investors might check daily or weekly charts. Pick a time frame that fits your trading style and goals.
Backtesting Doji-Based Strategies
Use strong backtesting methods to check how well your doji strategies work. Use past data to practice trades and look at how they perform. This helps improve your plan and builds trust in your trading.
- Test different doji types (e.g., dragonfly, gravestone) across various market conditions
- Evaluate entry and exit points based on doji formations
- Analyze win rates and average profit/loss per trade
By adding doji analysis to your trading plan, you’ll understand market dynamics better. Always update your strategies based on backtesting and real trading results.
Conclusion
Learning to master doji patterns is key for traders wanting to improve their market analysis. These special candlestick patterns show when the market is unsure or might change direction. Each type, like the long-legged doji, gives clues about who is in control.
Staying up-to-date is essential for trading success with doji patterns. They are great for spotting indecision and possible changes in the market. But, they work best with other tools and levels of support and resistance. Traders should look at longer time frames to avoid getting false signals.
Using doji patterns can really help with making trading decisions. They can be seen in different market conditions, helping traders know the best times to buy or sell. Remember, doji patterns are just one part of a good trading plan. With time and effort, understanding doji candlesticks can greatly improve your trading.


